ترجمه ریاضی -25 صفحه
Translation Mathematics - scatterplot
نمودار پراکندگی
دانلود رایگان مقاله انگلیسی - نمودار پراکندگی
نمونه متن ترجمه شده
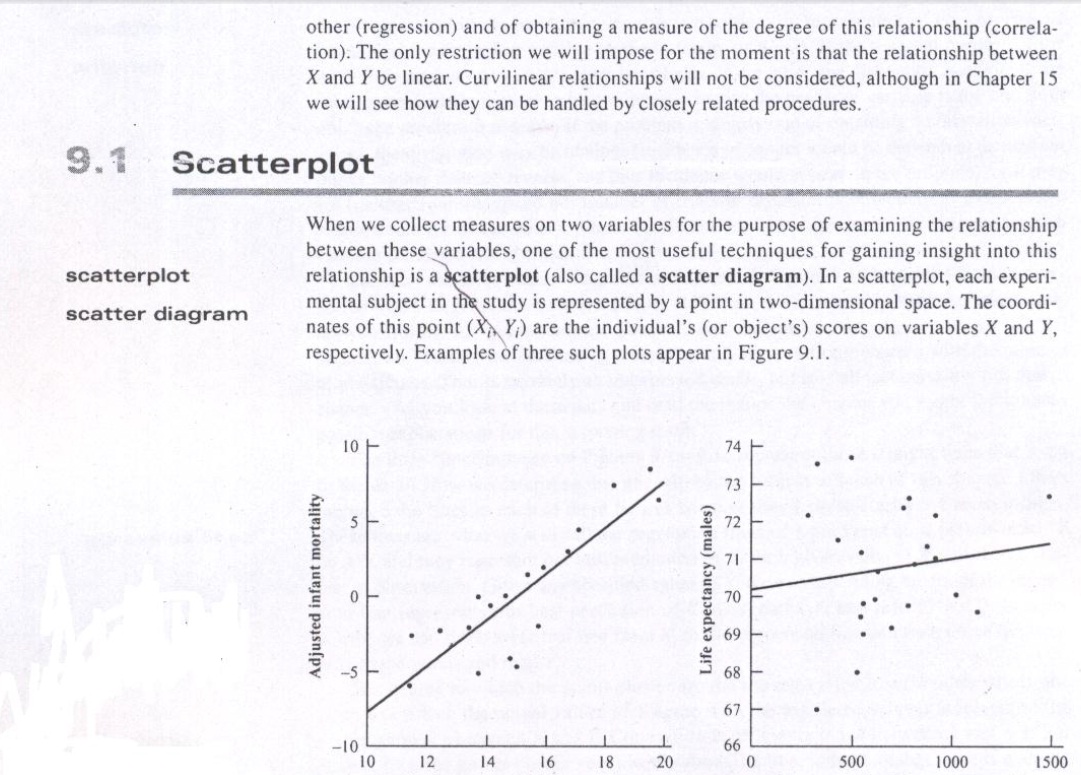
زمانیکه ما اندازه های روی دو متغیر را به منظور بررسی رابطه ی بین این متغیرها بررسی میکنیم، یکی از مفیدترین تکنیکها برای کسب نگرش نسبت به این رابطه، یک نمودار پراکندگی است (هم چنین یک دیاگرام پراکندگی نامیده میشود). در یک نمودار پراکندگی، هر موضوع آزمایشی در مطالعه، با یک نقطه در فضای دو بعدی نشان داده میشود. مختصات این نقطه (Xi,Yi) امتیازات انفرادی روی متغیرهای x و y (یا امتیازات شی) به ترتیب هستند. نمونه هایی از سه مورد از چنین نمودارهایی در شکل 9.1 آورده شده است.
A scatter plot (also called a scatter graph, scatter chart, scattergram, or scatter diagram)[3] is a type of plot or mathematical diagram using Cartesian coordinates to display values for typically two variables for a set of data. If the points are color-coded, one additional variable can be displayed. The data is displayed as a collection of points, each having the value of one variable determining the position on the horizontal axis and the value of the other variable determining the position on the vertical axis.
A scatter plot can be used either when one continuous variable that is under the control of the experimenter and the other depends on it or when both continuous variables are independent. If a parameter exists that is systematically incremented and/or decremented by the other, it is called the control parameter or independent variable and is customarily plotted along the horizontal axis. The measured or dependent variable is customarily plotted along the vertical axis. If no dependent variable exists, either type of variable can be plotted on either axis and a scatter plot will illustrate only the degree of correlation (not causation) between two variables.